As humans, we tend to see patterns everywhere. It’s important when making decisions, judgments, and acquiring knowledge. Pattern recognition is crucial to learning and incredibly important from an evolutionary perspective. Unfortunately, that same tendency to see patterns in everything can lead to seeing patterns that might be completely random in nature, especially when it comes to investment markets.
Some of the most well-known investment adages/patterns include, “sell in May and go away”, “the October effect”, as well as the “January effect”. These are all common patterns when it comes to investing but do they offer any value when we look at the data?
Should you sell in May and go away?
“Sell in May and go away” is an adage that average stock market returns tend to be lower during the period from May to October compared to the period from November to April, due to various summer-related economic slowdown factors (specifically in the Northern Hemisphere).
Whatever reasons there may have been to ‘sell in May’ in the past, the most important thing for investors is whether it would work in today’s world. Let’s examine the numbers.

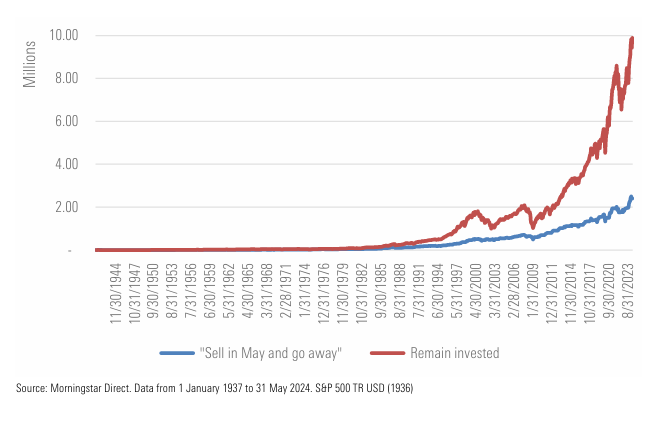
In the chart above we compare the investment journey of two investors who both invested $1 000 dollars at the beginning of 1936 in the S&P 500. The “Sell in May and go away” investor moved to cash on the 1st of May every year and returned to the stock market on the 30th of September every year, while the “Remain invested” investor left his $1 000 to compound throughout the entire investment period and made no changes to his strategy during the years.
We can see the large outperformance of the investor who remained invested throughout his journey with an ending value of more than $9 million, while the “Sell in May and go away” investor ended up with roughly $2 million.
What about doubling up in January and avoiding October?
The January effect is the supposed seasonal tendency for stocks to rise in the first month of the year as investors sell their losing stock in December for tax-loss harvesting while the October effect refers to the psychological anticipation that financial declines and stock market crashes are more likely to occur during this month than any other month. We can look back to the Bank Panic of 1907, the Stock Market Crash of 1929, and Black Monday of 1987 – all happened during October.
So, with this in mind, should we double up our investments in January and refrain from investing in October? Let’s look at the numbers.
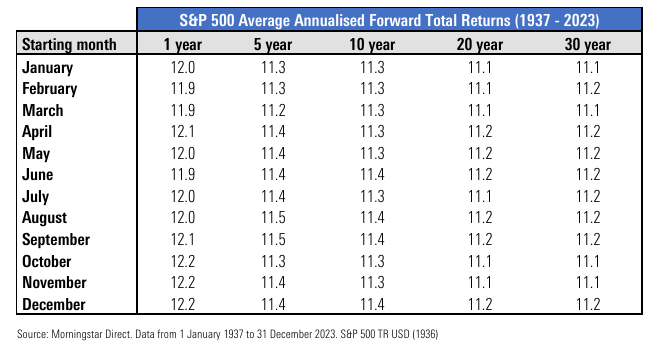
The table below looks at the average annualised returns had you invested at the beginning of each calendar month, and the data goes all the way back to January of 1937.

Even if we look at 1-year returns, the divergence between starting months is almost negligible – with average one-year returns ranging be
If we look at 10-year annualised returns, the average is either 11.3% or 11.4%. So there really is no particular month that stands out as the best (or worst) entry point.
In summary
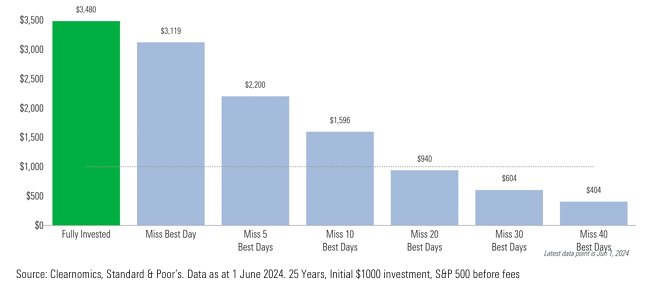
A long-term investor need not be concerned with the month they enter the markets. Instead, they should shift their focus to remaining fully invested, so that they don’t miss out on the best days, which could randomly occur at any given moment of their investment lifetime.
Just consider the graph below showing the value of staying invested, reminding us of the fact that missing only the best 10 days in the market can cost you close to 50% of your ending value after 25 years.

Patterns are important when making decisions, judgments, and acquiring knowledge. But they might not be as helpful when it comes to your investments. Sticking to your financial plan and riding out the short-term movements while focusing on your long-term goal means that every month is a good month to invest when you are a long-term investor.
#Month #Good #Month #Invest #LongTerm #Investor


